About these case studies: All projects below are portfolio demonstrations built with synthetic data. They mirror real-world problem patterns we've worked on across environmental, operations, and analytics domains — with numbers, names, and structures adjusted to protect client confidentiality. Live client engagements are covered under NDA; references available on request.
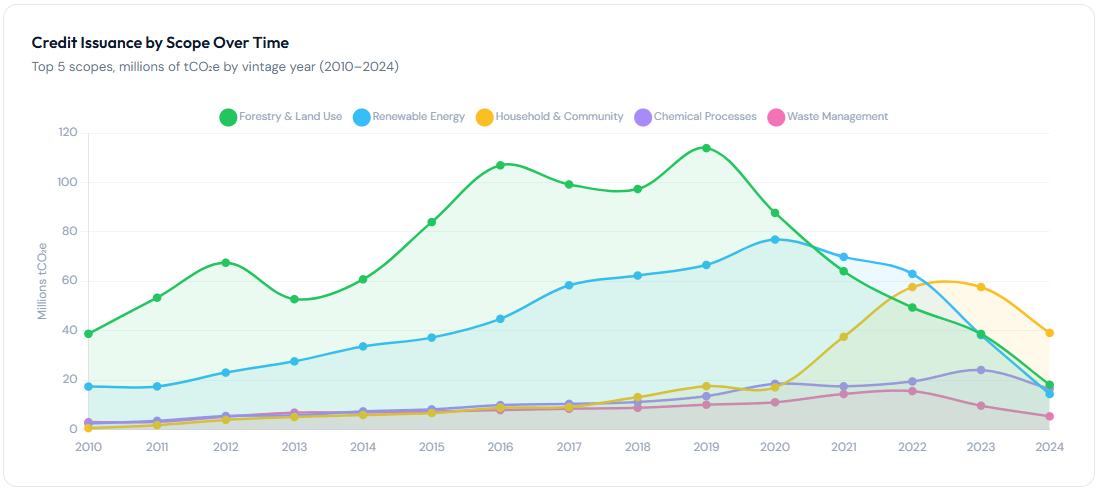
Mapping the Global Voluntary Carbon Offsets Market
Transformed a 168-column, 10,975-row registry database into an interactive market explorer — tracking 2.55B credits across 5 registries, 147 countries, and 30 years of vintage data with zero BI license cost.
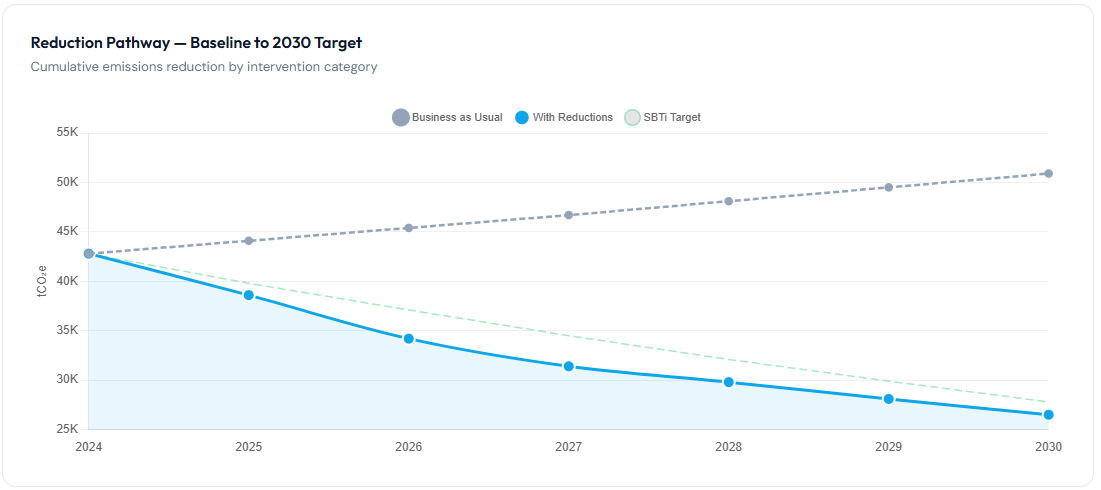
Carbon Footprint Analysis & Reduction Roadmap
Conducted a full Scope 1/2/3 emissions audit for a 340-vehicle logistics company, identified that 72% of emissions came from just 2 sources, and built an interactive reduction pathway modeler with 6 adjustable intervention levers.
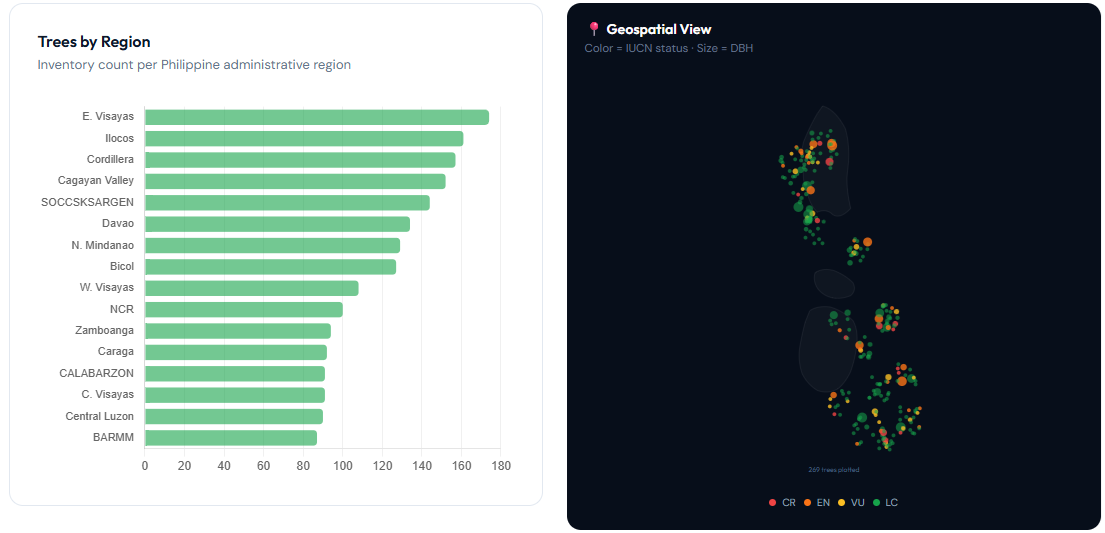
Philippine National Tree Inventory Explorer
Transformed a PDF tally sheet into an interactive geospatial dashboard — mapping 1,931 trees across 16 regions and 36 species with IUCN conservation tracking, health assessments, and timber volume analytics.
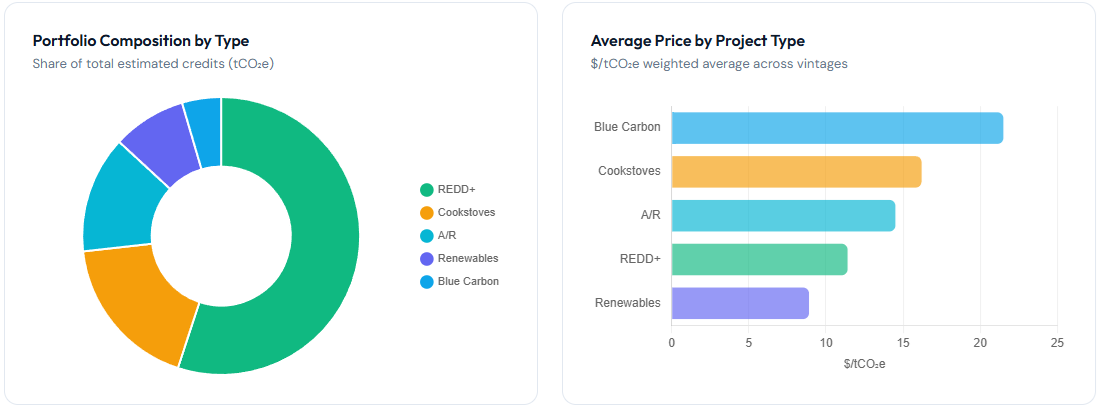
Carbon Credit Tracking & ESG Portfolio Dashboard
Built a portfolio-level dashboard for a carbon project developer managing 18 projects across 6 countries — tracking 4.8M tCO₂e from estimation through verification and sale, with vintage analysis and revenue forecasting.
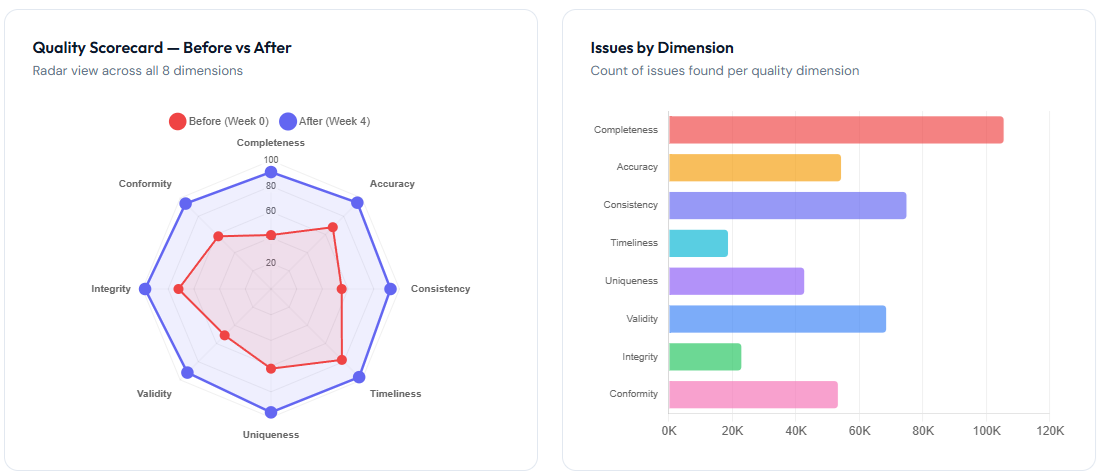
Data Quality Audit & Remediation System
Conducted a structured audit across 8 quality dimensions on 1.2M records, found 340K issues, built 18 automated cleanup scripts and deployed 24 real-time prevention rules that catch errors at the point of entry.
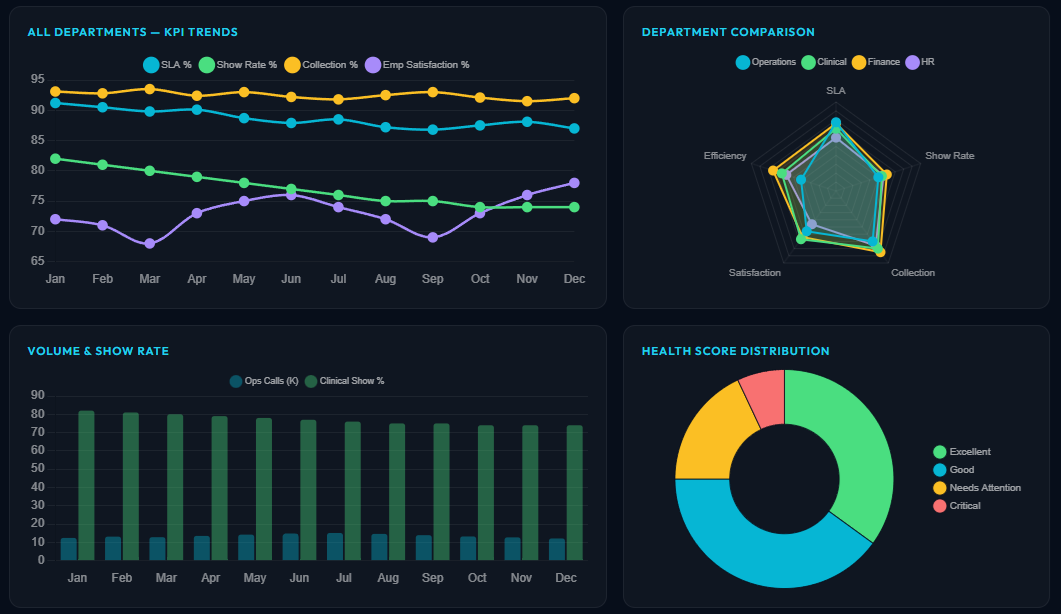
Reporting Unification & The Zero-License Dashboard
Eliminated $18K/year in BI licenses by replacing 7 fragmented Tableau, Excel, and PDF reports across 4 departments with a single interactive web dashboard — standardizing 15 KPIs with daily automated refresh.
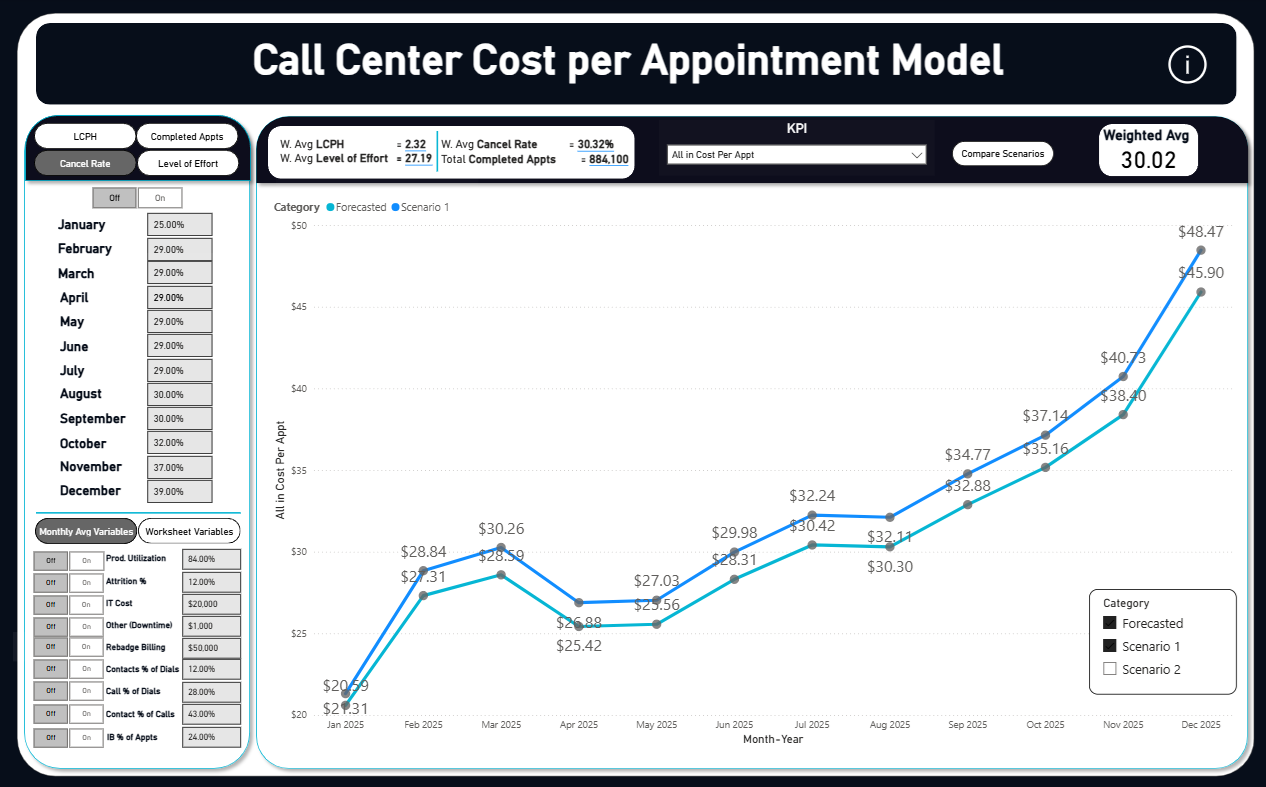
Cost per Appointment Scenario Planning Model
Built a 3-scenario interactive model that calculates cost-per-appointment in real time as users adjust 20+ operational variables — from LCPH and cancellation rates to billing tiers and training attrition.
Live client engagements — under NDA
Our active client work (including ongoing Philippine supply-chain and carbon consultancy engagements) is covered under NDA. We're happy to share details and references on request once we've had a discovery call. Book a diagnostic to discuss your project.